1. POWER BI APP INTEGRATION DISCLAMER
This Power BI integration is provided free of charge. Due to limitations in our in-house expertise, we do not offer specific support for Power BI. For issues related to Power BI, please consult a local specialist. For inquiries about our REST APIs used in this Power BI integration, feel free to contact our support team at helpdesk.blyott.com
2. POWER BI DASHBOARD – INSTRUCTIONS
- Updating Blyott Login Credentials:
- Open the file in Power BI Desktop.
- Under "Home" tab of the ribbon click, on the down arrow below the "Transform data" option.
- In the dropdown menu, click on the "Manage Parameters" option.
- The "Manage Parameters" window will open, allowing you to update the Username and Password parameters.
- Refreshing Dashboard
- Click on the "Home" tab in the ribbon menu.
- Click on the "Refresh" button in the "External Data" section.
This action refreshes all data sources and updates your dashboard with the latest data.
- Customizing Tables:
To make common changes to the table view, follow the instructions below.
Note: Custom columns have not been added to the table view as they may differ for each user:
- To add a column:
- Click on the table visual to select it.
- In the Visualizations pane on the right side of the screen, click on the Fields tab.
- Drag and drop the desired field from the list onto the Values section of the Visualizations pane.
- Click on the table visual to select it.
- In the Visualizations pane on the right side of the screen, click on the Fields tab.
- Click on the x icon next to the field you want to remove.
- Click on the table visual to select it.
- In the Visualizations pane on the right side of the screen, click on the Format tab.
- Expand the Column headers section.
- Drag and drop the column headers to the desired position.
- Click on the table visual to select it.
- In the Visualizations pane on the right side of the screen, All the columns are listed in the column section.
- Double click on the column name to edit it.
- Press Enter from keyboard after making changes.
Dasboard View:
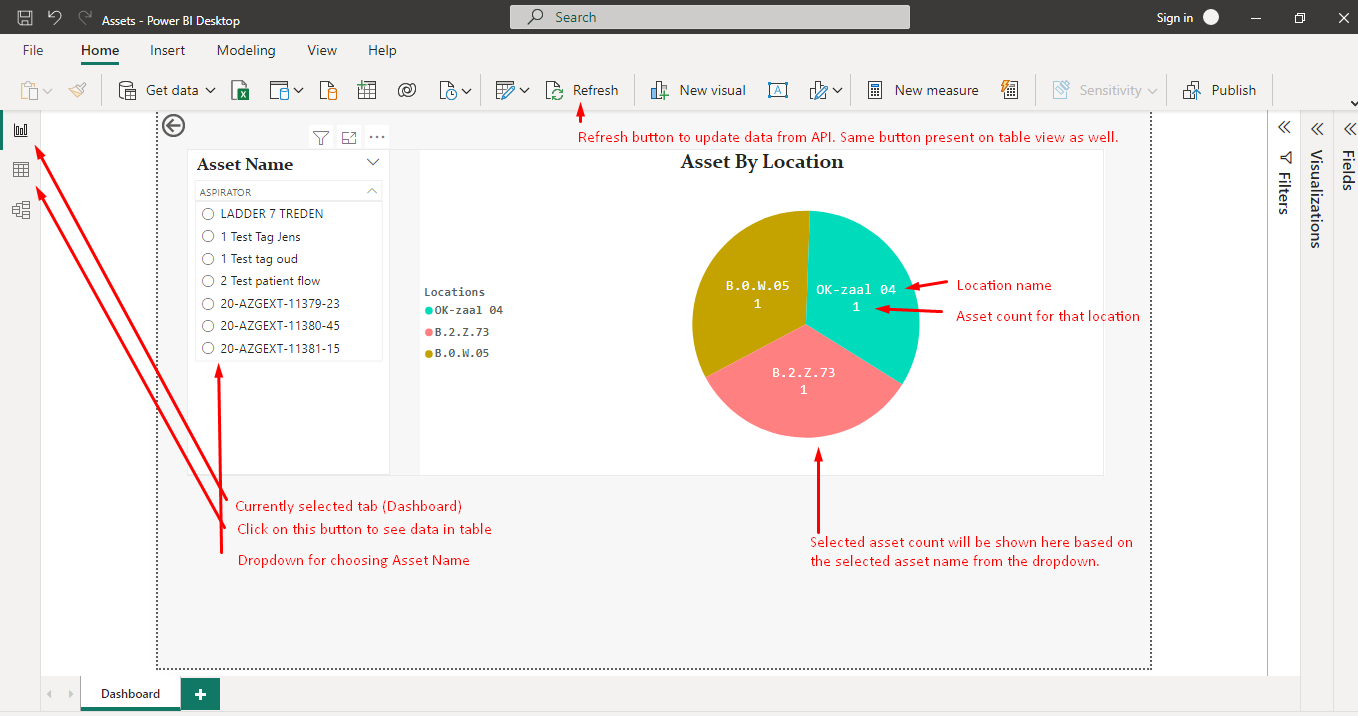
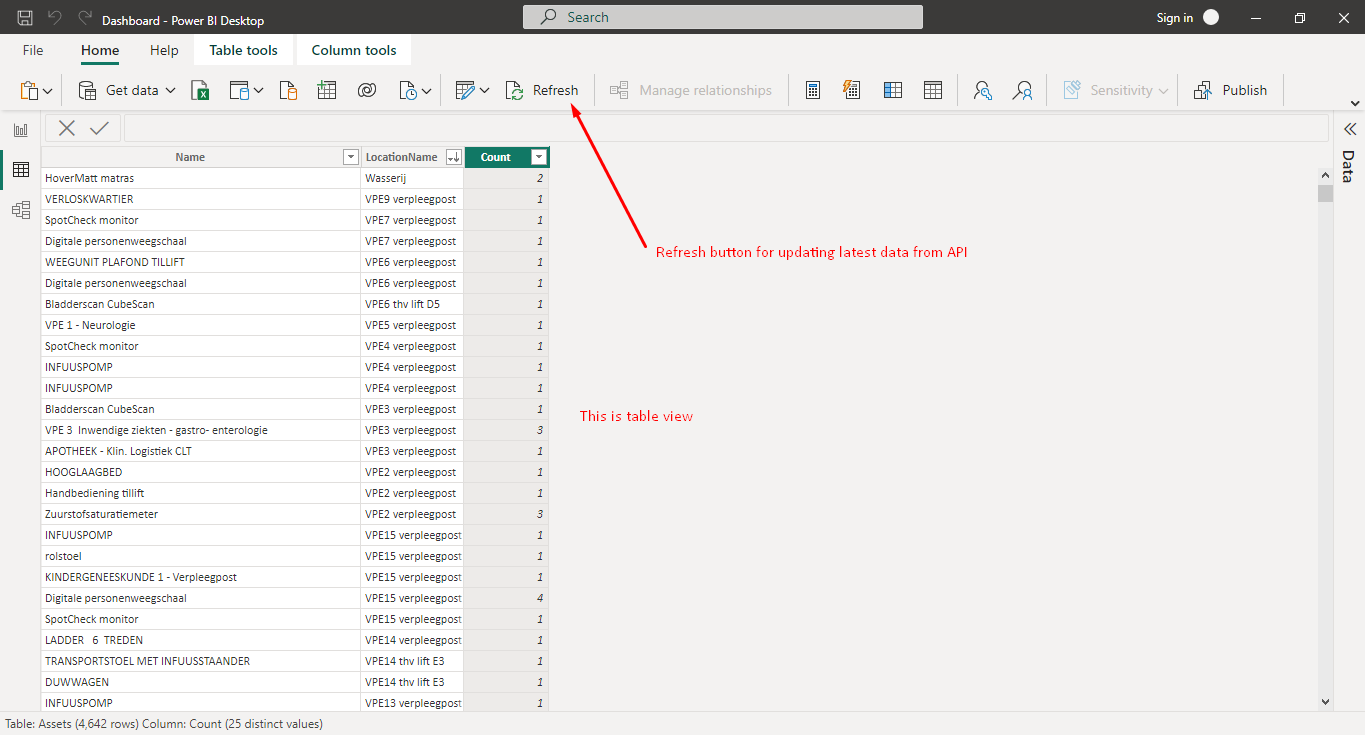
Table View:
3. PAGES
Screen 1:
- At the top of the screen, you can find filters that allow you to apply asset type, location, zone, and date range filters.
- The clustered bar chart on the dashboard displays the number of assets in different zones, grouped by asset type. The chart updates dynamically every time a field selection change.
- There is also a pie chart that displays the number and percentage of asset types in a selected location. This chart also updates every time when a field selection changes.
- Users can set minimum and maximum limits on the number of assets based on asset type, location, and zone. If the number of assets of a certain type fall below the minimum or exceeds the maximum limit defined by the customer, the corresponding cards at the top, holding the number of total assets, will change their color to red.
- At the top of the screen, you can find filters that allow you to apply asset type, location, and zone filters.
- A clustered column chart on the dashboard displays the number of hours an asset is present in a specific location.
- At the top of the screen, you can find filters that allow you to apply asset type, location, zone, and date range filters.
- The table visual displays all the fields from Asset table, except for custom fields. Because custom fields can vary depending on the user. However, users can easily add their own custom fields by following the instructions outlined in the Customizing Tables section.
- The table visual displays all the fields from Tag table, except for custom fields. Because custom fields can vary depending on the user. However, users can easily add their own custom fields by following the instructions outlined in the Customizing Tables section.
- The table visual displays all the fields from Locations table, except for custom fields. Because custom fields can vary depending on the user. However, users can easily add their own custom fields by following the instructions outlined in the Customizing Tables section.
- The table visual displays all the fields from Locators table, except for custom fields. Because custom fields can vary depending on the user. However, users can easily add their own custom fields by following the instructions outlined in the Customizing Tables section.
4. BLYOTT SUPPORT & ASSISTANCE
Within this Help Center, we aim to provide you with useful information, documentation, and guidance that will enable you to make the most out of your access to the Blyott Platform. In the Knowledgebase section you can find a video walkthrough guide for the support page, Release Notes, Documentation, Manuals, and “How to” guides.
Please be reminded that you need to register/log in to the support page to access all Blyott-related documentation.
If you have any questions or suggestions at all, please feel free to get in touch with us at helpdesk.blyott.com
Thanks and regards,
The Blyott Support Team